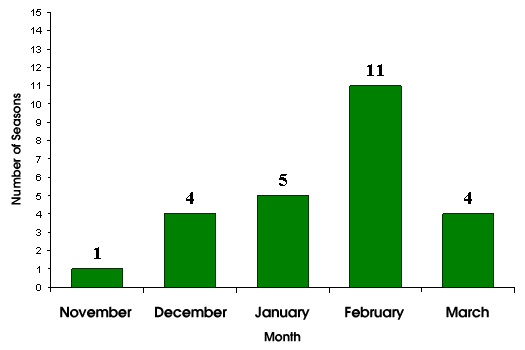
 I had not run across this graphic before, although I had always suspected this data to be true. This shows the peak of the flu season for the past 25 years.
As you can clearly see, this year seems to have followed the majority with a peak in February.
This does NOT mean it is over! Just a good chance it is over.
Please, please, please, please DO NOT stop washing your hands and covering your coughs and sneezes, please.
Peak Month of Influenza Activity Over the
Previous 25 Seasons 1982-83 through 2006-07
No comments:
Post a Comment